
Oakland’s mayoral battle is over: How much did candidates pay for your vote?
on November 17, 2014
In the 2014 race for Oakland mayor, the candidate who spent the most money per vote didn’t walk away with the most first-place ranked-choice votes.
In order to determine how much the mayoral candidates spent to earn your first-choice vote, Oakland North analyzed two sets of figures: how much they spent, and how many votes they got. On October 18, candidates for Oakland offices had to turn in their California Form 460, which detailed their campaign spending, as well as how much they took out in loans, and how much money was left in their accounts at time of filing. These forms showed that candidates in the mayor’s race had spent a total of $1,767,757.85 by that date. These forms can be found online at the City of Oakland’s Netfile portal; Oakland North’s calculations include expenditures from candidates in 2013 and 2014.
Under Oakland’s ranked-choice voting system, voters can choose up to three candidates in order of preference. For this analysis, Oakland North focused only on first-choice votes, using the total that had been tallied by the Alameda County Registrar of Voters’ office on November 6. (The office has 28 days from the election to certify the final count, which is expected to change slightly as provisional ballots are tallied, but is not expected to shift the outcome of the election.) We divided the amount of money each candidate spent by the number of first-choice votes received to arrive at the cost per first-choice vote.
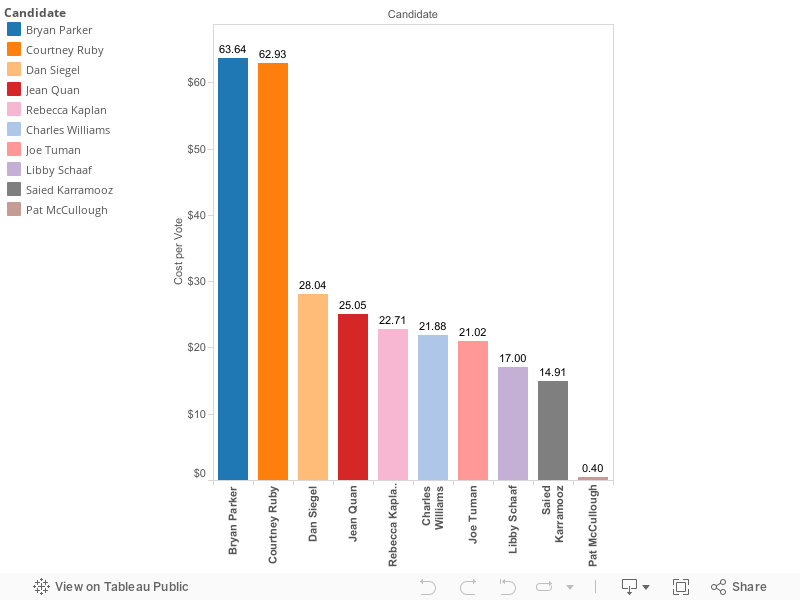
According to her Form 460, mayor-elect Libby Schaaf spent $341,503.55 on her campaign, and by November 6 was leading the race with 20,094 first choice votes. That gives her a price tag of $17 per first-choice vote.
In comparison, current mayor Jean Quan, who came in second, spent $25.05 for each of her 10,889 first-choice votes. First-time mayoral candidate Bryan Parker spent the most per vote: $63.64 for his 5,546 first-choice votes.
Courtney Ruby, Oakland’s city auditor, was just behind Parker in spending per vote. She spent $62.93 for her 2,202 first choice votes. Joe Tuman, a professor, spent $21.02 for each of his 8,606 votes. Oakland’s at-large city councilmember Rebecca Kaplan spent $22.71 for her 9,978 votes. Pat McCullough, who only spent $100 on his campaign, paid $.40 for each of his 248 votes.
Next, Oakland North wanted to learn how these spending figures compared to an average, in order to determine whether the candidates who spent the most per vote were simply big spenders, or if that figure was high because they received very few votes. Conversely, we wanted to know if the candidates who appeared to spend very little per vote were low spenders overall, or if they spent as much as their fellow candidates but managed to turn out a higher following among voters.
In this race, there were several outliers among the 15 mayoral candidates’ expenditures. Five candidates did not spend any money at all, and two spent very little: McCullough spent $100, and businessman Saied Karamooz spent $2,609. None of these candidates received more than 1,000 votes, and all were eliminated during the early stages of ranked-choice balloting.
Including their spending figures would have driven the average artificially low, so Oakland North calculated an average based on the spending of the seven candidates who had received the most first-place ranked choice votes as of November 6: Schaaf, Quan, Kaplan, Tuman, Parker, Ruby and attorney Dan Siegel. Together, these candidates spent an average of $249,820.85 per campaign, and had an average cost per vote of $34.34.
At $63.64 per vote, Parker not only spent the most per vote, but overall his campaign spent 40 percent more than the average—a total of $352,954.
On the other hand, Ruby had the second highest cost per vote at $62.93, but her campaign spent 45 percent less than the average, only $138,573.
Winner Schaaf outspent every candidate except Parker by a significant amount. Her campaign spent $341,503, 37 percent higher than the average. This means that her low cost per vote—$17—reflects the high number of voters who selected her first, but not a modest budget.
The campaigns for Siegel, Quan, and Kaplan spent close to the average, and all three had similar costs per vote: $28.04, $25,05 and $22.71 respectively.
Three candidates ran for mayor in both 2014 and 2010, the first time ranked choice voting was used. Kaplan, Quan, and Tuman ran for the position in 2010, with Quan ultimately winning.
Oakland North compared the spending figures from 2014 to 2010 to see if the repeating candidates had changed their spending habits. But there are some significant differences to take into account between the two election cycles. Voter turnout was far higher in 2010, which drove down the price candidates spent per vote. This year, there were also 15 mayoral candidates, compared to 10 in 2010. This gave voters more choices, and may have resulted in the frontrunners getting fewer votes, and therefore paying more per vote.
In 2010 Jean Quan spent $324,522.28 to win 29,266 first-choice votes, giving her a cost per vote of $11.09. This year, she got 63 percent fewer votes, and paid $25.05 for them, a price nearly 126 percent higher.
Kaplan spent about the same amount in 2010 ($229,937.84) that she did in 2014 ($226,614.66), but this time got 61 percent fewer votes. She spent only $8.91 per first-choice vote in 2010, but $22.71 for them this year.
Tuman spent 51 percent more this year ($180,858) than he did in 2010 ($119,393) and got 40 percent fewer votes. His cost per first-place vote rose from $8.32 in 2010 to $21.01 this year.
Candidates in 2010 spent a total of about $1 million. This year, candidates spent around $1.7 million. Bill Adams, a professor of public policy at The George Washington University in Washington, D.C., who studies political science, says that this increase is expected. “U.S. election spending invariably increases every successive midterm election and every successive presidential election year,” Adams wrote via email.
Henry Brady, Dean of the Goldman School of Public Policy at UC Berkeley, said, “We’re in an era where campaign spending is going up all across the country.”
But, Brady said, “spending is not necessarily the answer” when it comes to winning elections. “People who spent a lot per vote didn’t do as well,” he pointed out. Brady said that part of the problem for Oakland contenders was that they played on such a crowded field, “so it was hard to gain any traction. Spending was necessary, but not sufficient. You needed more than that.”
What more did you need? Name recognition, Brady said. “If you look at the people who did really well, as far as vote per dollar,” he said, “they had some sort of name recognition to start with.” When talking about the expenditures of two of the top three spenders, Brady said, “All that spending didn’t help them that much, and some people just don’t break through. That is apparently true for Bryan Parker and Courtney Ruby.”
Adams says that the increase in spending may also be attributed to the ranked-choice system. “Ranked-choice voting probably encourages more candidates to run because think they might have a chance and thus increases total spending,” Adams wrote.
Katherine Gavzy, president of the League of Women Voters of Oakland, said via email that, when ranked-choice voting was implemented in 2006, one of the original arguments was that, “by eliminating the primary election and reducing the amount of time that candidates would have to spend campaigning, it would also reduce the need to raise campaign money.”
“Intuitively,” she continued, “this makes sense, but unfortunately I have not seen a professional analysis to either support or refute it.”
Representatives from Quan and Schaaf’s campaigns did not return Oakland North’s requests for comment on their spending by time of publication. Jason Overman with the Rebecca Kaplan campaign, declined to comment. But Dan Bellino, speaking for the Parker campaign, wrote via email, “We are proud of the positive campaign we ran—including the strategic spending decisions we needed to make in order to push for greater equality across all of Oakland.”
Voters won’t know the full cost per vote or exactly how much each candidate spent until early next year. Candidates aren’t required to fill out their final expenditure reports until February 2, 2015; these forms will cover the period of October 19 through December 31. The final election tally numbers also won’t be fully certified until after all provisional ballots are counted, a process that must end within 28 days after election.
The story was updated to correct the timeframe in which the registrar must certify the election results, and to correct an error about which candidate had spent the most on their campaign.
-

- Cost per vote figures for the 2014 Oakland mayoral candidates. Figures were determined by dividing total campaign expenditures from 2013 through October 18, 2014 by the total number of first choice votes as of November 6, 2014 . Peter Liu, Nancy Sidebotham, Ken Houston, Eric Wilson, and Jason “Shake” Anderson did not record any expenditures. Pat McCullough was not included as he spent $100 on his campaign.


2 Comments
Leave a Comment
Oakland North welcomes comments from our readers, but we ask users to keep all discussion civil and on-topic. Comments post automatically without review from our staff, but we reserve the right to delete material that is libelous, a personal attack, or spam. We request that commenters consistently use the same login name. Comments from the same user posted under multiple aliases may be deleted. Oakland North assumes no liability for comments posted to the site and no endorsement is implied; commenters are solely responsible for their own content.

Oakland North
Oakland North is an online news service produced by students at the UC Berkeley Graduate School of Journalism and covering Oakland, California. Our goals are to improve local coverage, innovate with digital media, and listen to you–about the issues that concern you and the reporting you’d like to see in your community. Please send news tips to: oaklandnorthstaff@gmail.com.


You are missing something. The unions and the democratic club spent an enormous amount of money for Quan and Kaplan that was not counted.
They tried to buy the election. It obviously didn’t work on the mayor’s race, but they managed to get a number of union friendly candidates into the city council just in time for salary discussions.
Not sure why you are using vote totals from 11/06 for this story. You are only counting about 2/3 of the vote in your analysis, and updated vote totals have been available for a week now.
For example, your piece states that Libby Schaaf received 20,094 first place votes, however the updated vote totals that have been available for a week now show that she received 29,983 votes — 9,889 more than are in your analysis. So instead of the $17.00 per vote you report in your story she actually spent $11.39 per vote. A HUGE difference!
This is just sloppy reporting. Also, comparing this year’s vote totals to 2010 when you are only counting 2/3 of the 2014 votes is bad practice from any perspective. This story was published on 11/17, and updated vote totals have been available since 11/12. Why would you publish a story like this with outdated, incomplete data when new, complete data has been available for a week before publication?
SMH at “journalism” these days.